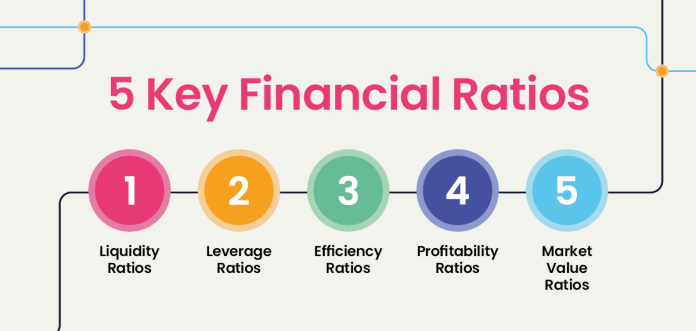
Analyzing a company’s financial ratios provides valuable knowledge of its performance. Financial ratios are required to track a company’s performance, liquidity, efficiency, and profitability. Investors often use these ratios to compare different companies and make proper decisions on where to invest. Continue reading to learn all about the most important financial ratios to analyze a company.
Most Important Financial Ratios to Analyze a Company
There are six ratios that are important to analyze any company. They are elucidated below.
-
Working Capital Ratio
The Working Capital Ratio is used to measure a company’s liquidity. Most importantly, it is used to measure its ability to convert assets into cash to meet short-term debts. The Working Capital is calculated by subtracting current liabilities from current assets. Also, the Working Capital ratio is determined by dividing current assets by current liabilities.
For instance, if a company has current assets worth $8 million and current liabilities worth $4 million, then its working capital ratio would be 2. This implies that the company carries twice as many assets as liabilities. This suggests that it has good short-term liquidity. However, if two similar companies have a working capital ratio of 2, then the one with the higher cash reserves gets to pay off its debts quickly.
A working capital ratio of 1 may indicate potential liquidity problems. This could mean that the company could struggle to pay off its short-term liabilities. However, a ratio of 2 or higher implies healthy liquidity.
Also read: Biggest Stock Market Crashes in US History: Key Lessons
-
Quick Ratio
This is referred to as the acid test, which is another crucial measure of liquidity. It assesses a company’s ability to pay current liabilities using most liquid assets. This excludes inventory, which may take longer to cash. The quick ratio is calculated as – Quick Ratio = (Current Assets – Inventory – Prepaid Expenses)/Current Liabilities.
For instance, if a company carries $8 million as its assets, $2 million in its inventory and prepaid expenses, and $4 million in its current liabilities, the quick ratio would be 1.5. This implies that the company possesses enough liquid assets to cover its short-term obligations. However, a quick ratio of less than 1 may imply insufficient liquid assets to meet current liabilities. Then, the company may have to raise capital or take other corrective measures.
-
Earnings Per Share (EPS)
EPS is also a significant measure to calculate a company’s profits. It shows how much profit a company makes for each share of its stock. It also offers suggestions for the company’s financial performance. EPS is calculated by dividing net income by the weighted average number of common shares outstanding during that year. A higher EPS implies greater profits and it’s generally seen positively by investors.
However, if a company shows zero or negative earnings, the EPS will also reflect this, showing financial struggles.
-
Price-to-Earnings (P/E) Ratio
The Price-to-Earnings (P/E) ratio is helpful in checking a stock’s value and growth potential. It indicates how much investors are willing to pay for each dollar of their earnings. The P/E ratio is calculated by dividing the current stock price by earnings per share.
For instance, if a company’s stock is priced at $46.51 and its EPS is $4.90, the P/E ratio would come to approximately 9.49. This implies that the investors would be willing to pay $9.49 for every dollar of earnings. A high P/E ratio suggests that investors expect future growth. On the other hand, a low P/E ratio suggests that a stock is undervalued. If a company reports zero or negative earnings, the P/E ratio becomes meaningless.
Also read: Complete Mortgage Home Buying Checklist for 2025
-
Debt-to-Equity (D/E) Ratio
The D/E ratio measures the amount of a company’s financing that comes from debt versus shareholder equity. A high D/E ratio implies increased financial risk. It can raise concerns about the company’s ability to repay its debts. The D/E is calculated by dividing the total liabilities by the total shareholders’ equity.
For instance, if a company has $3.1 million in loans and $13.3 million in shareholder equity, the D/E ratio would be approximately 0.23. this shows a relatively lower level of debt compared to equity. This is considered a positive sign. However, it is essential to compare this ratio to industry norms. This is because acceptable levels of debt can vary in each sector.
-
Return on Equity (ROE)
Return on Equity (ROE) shows how effectively a company uses shareholder equity to generate profits. This is shown in percentage. It is calculated by dividing the net income by total shareholders’ equity.
For instance, if a company shows a net income of $1.3 million and a total shareholder equity of $8 million, the ROE would be 16.25%. A higher ROE would imply that the company is effectively utilizing investor’s funds to generate earnings. This can enhance the shareholder’s value over time. A steady increase in ROE is indicative of a company’s financial health and operations.
These six ratios can aid companies as well as investors in navigating the financial markets and making correct decisions. It is important to view these ratios collectively to make more informed investment decisions. Comparing these ratios to industry averages and benchmarks can also aid in identifying potential investment opportunities.


